
Earnings of Programs Can Vary Widely – Even Within the Same Field of Study
Over the last decade, attention to the financial value associated with attending different higher education programs has dramatically increased, fueled by newly available data linking college credential completers to administrative data on their earnings. Among the most important initiatives are the U.S. Department of Education’s College Scorecard, which has released information on the typical earnings of program graduates for nearly all federally aided students since 2019; the Census Bureau’s Post-Secondary Employment Outcomes (PSEO), which produces earnings outcomes for all students graduating from voluntarily participating institutions; and many state higher education systems’ employment and earnings outcomes dashboards, which show outcomes for students based on the state’s administrative data systems. Together, this new information gives students better information to inform their choices, and has increasingly drawn the attention of policymakers interested in concentrating funding resources in programs with demonstrated returns on public investments.
A key technical decision in producing program-level measures lies in how granularly to categorize distinct programs by field of study (or college `major’) within a given credential level. Nearly all federal and state sources of earnings outcome data rely on the Classification of Instructional Programs (CIP) system developed by the National Center for Education Statistics. The most granular level of reporting uses six-digit codes (called ‘CIP6 codes’) like Blood Bank Technology Specialists, (51.1001), Dialysis Technicians (51.1011), and Medical Lab Techs (51.1004). These specific fields are organized to allow identification of related fields by identifying fields with the first four digits (‘CIP4 codes’) or two digits (‘CIP2 codes’) in common. For example, the three examples above share the common CIP4 code 51.10, or “Clinical/Medical Laboratory Science and Allied Professions,” along with 10 other CIP6 fields. And 51.10 shares the CIP2 code “Health Professions and Related Clinical Sciences” with 34 other CIP4 fields, including medicine/MD (51.12), medical assisting (51.08), mental and social health services (51.15), veterinary medicine (51.24), energy and biologically based therapies (51.37), and many other fields.
The CIP2 field 51, Health, is an especially broad and diverse field, but illustrates a key point: The type of study and the occupations associated with different fields can be quite different across CIP6 fields within the same CIP4, and can be radically different across CIP4 fields within the same CIP2 code.
Ideally, earnings outcome data for credentials at different institutions could be made available at the most granular CIP6 level to give the most accurate information possible. However, that is often not possible, since many CIP6 programs have few completers in a given year, and privacy rules do not allow their median earnings data to be published in order to protect individual information. As a result, almost all of the sources of earnings data noted above only publish earnings data at the CIP4 or even CIP2 level. The College Scorecard publishes earnings for consecutive cohorts of completers only at the CIP4 level. PSEO similarly publishes outcome data at the CIP4 level for most programs, and for some graduate programs that tend to have smaller cohorts, publishes data only at the CIP2 level.
While these have been the most detailed data available to assess different programs to date, that is scheduled to change soon with data that will be produced by the U.S. Department of Education (ED) to administer the accountability provisions of the One Big Beautiful Bill Act (OBBBA) and the gainful employment rules. The OBBBA requires that ED publish, and determine eligibility for participation in federal student loan programs based upon, median earnings outcomes for programs measured at the CIP6 level whenever possible. In cases where the number of graduates in a particular institution's CIP6 program is small, even after including multiple years’ worth of students, the statute gives ED authority to publish outcome data at higher levels of aggregation – including by using coarser (CIP4 or CIP2) definitions of field of study. (We will return to the important implications of our analysis for these accountability rules later in the brief.)
During a recent rulemaking regarding OBBBA implementation, for the first time, ED released data reporting the median earnings of programs at the most granular six-digit CIP code level within each credential level – the level used as the base for the accountability rules mentioned above. These data provide a new opportunity to assess the variation in labor market outcomes across specific programs, which has, until now, been hidden by reporting these outcomes at the coarser CIP4 level. We provide examples using national, program-level median earnings data, combined across schools, for students earning undergraduate certificates. Though the new, more detailed data will be available for all credential types, we focus on undergraduate certificate programs, which (on the whole) have a higher share of their students in programs that fall short of the new accountability standards.
For Many Specific Fields of Study, Earnings Are Masked When Combined in Broader Categories
A key concern, both for consumer information and for accountability, is whether combining CIP6 earnings outcomes prevents transparency into the lower-earning fields within a given (CIP4) field – or whether it does a disservice to the higher-earning ones. In the program-level data, there are 224 undergraduate certificate CIP4 fields with three-year median earnings data present. Of those, about half have only a single CIP6 within the CIP4; but the other half, 110 CIP4 fields, report data for at least two underlying CIP6 programs. For about 70 percent of those undergraduate certificate CIP4 fields of study with at least two underlying CIP6 fields, the range between the lowest- and highest-earning CIP6 underlying programs is $10,000 per year or more.
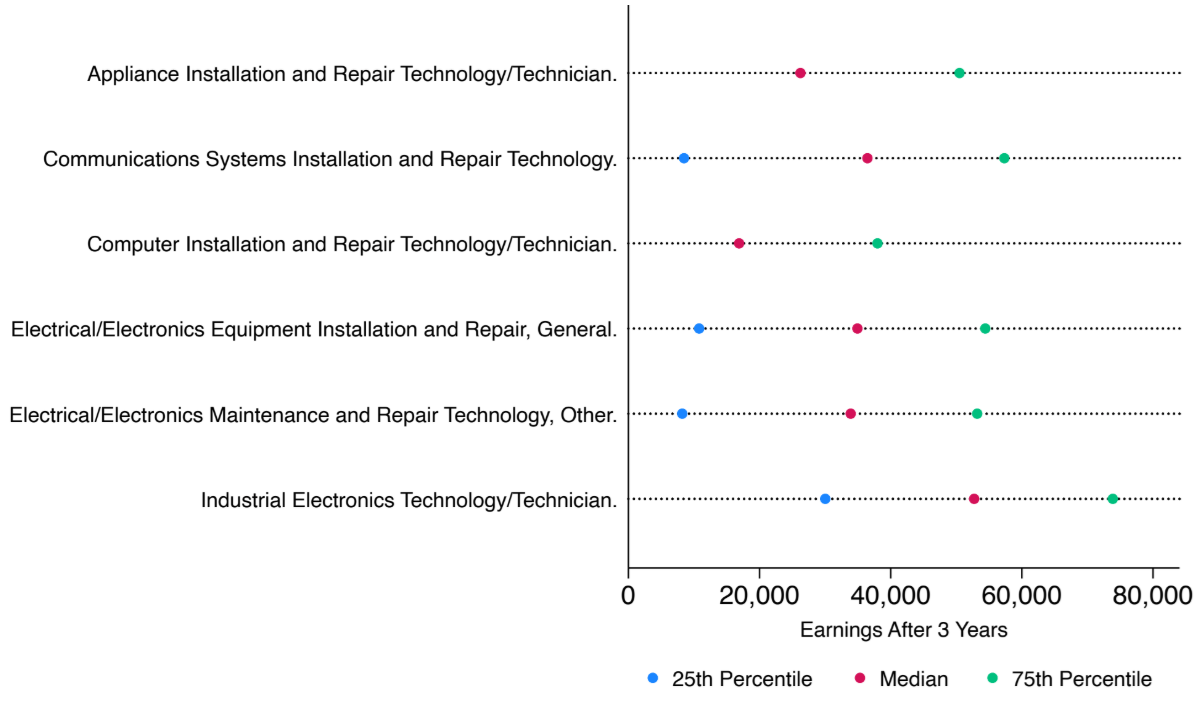
In some cases, this problem might exist only for one or two programs within a field of study. Take, for example, undergraduate certificate programs in electronics maintenance and repair (CIP code 47.01). Figure 1 displays the median earnings outcome in red (as well as the 25th and 75th percentiles in blue and green, respectively) for each program underlying that field of study, measured nationally. Though the three-year median earnings for graduates of five of the six programs are around $30,000 or above, the three-year median earnings for graduates of the computer installation and repair technician (47.0104) program is lower – less than $20,000. A student only given earnings data at the four-digit CIP code level might elect the computer repair program, without realizing the expected earnings for that program are considerably lower than for any other adjacent program within the same CIP4. Depending on the number of students in each of these programs, the low earnings of one (or the high earnings of another) could drag the CIP4 earnings up or down without accurately presenting the outcomes of some.
Fig 1. Undergraduate Certificate Programs in Electronics Maintenance and Repair (CIP4 of 47.01)
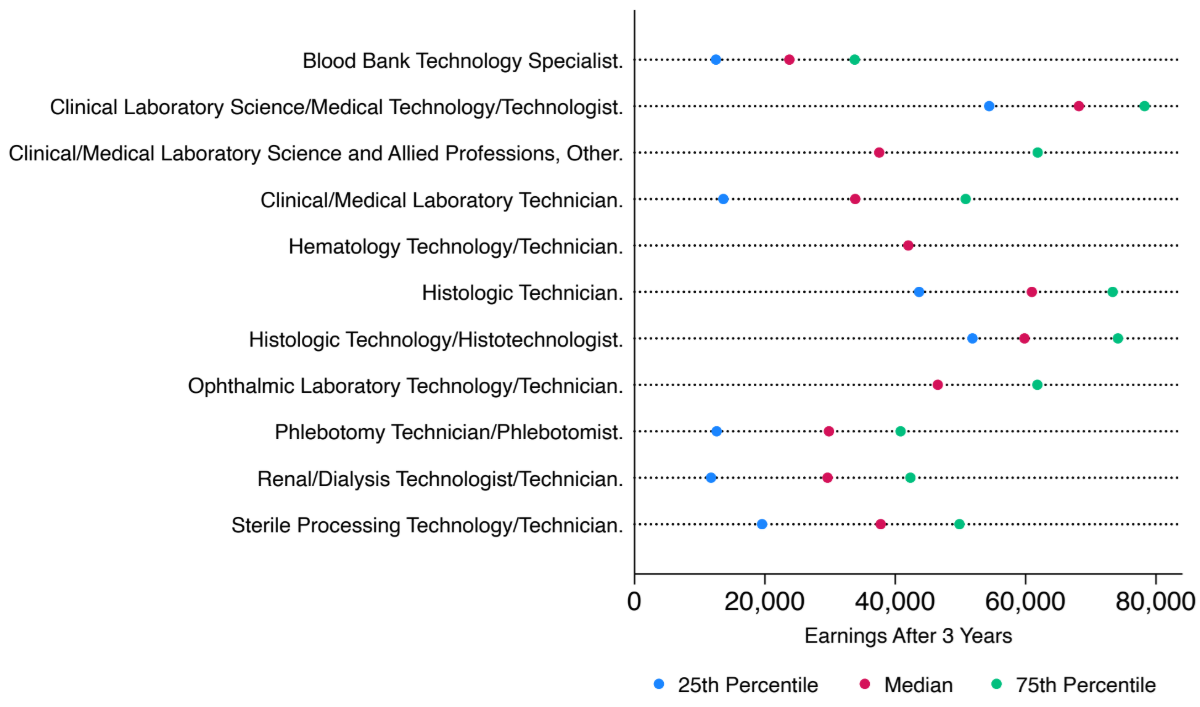
In other cases, the median earnings at the CIP4 level may not be a good representation of any of the individual program outcomes, because those programs’ earnings are so varied. In Figure 2, which displays the median earnings three years after graduation for individuals earning certificates in clinical and medical laboratory science (CIP4 of 51.10), outcomes at the CIP6 level demonstrate a fair amount of scatter. The median earnings of those with blood bank technology (CIP6 of 51.1001) certificates, for instance, or dialysis technician certificates (CIP6 of 51.1011), have median earnings of less than $30,000. Other programs within the same field, like clinical laboratory science (CIP6 of 51.1005) and histologic technician (CIP6 of 51.1008), are closer to $60,000 in median earnings. In cases like this, combining all program data at the CIP6 level—ranging from $24,000 to $68,000—and identifying the median at the CIP4 level means that the field-of-study median may not be very accurate for any of the programs.
Fig 2. Undergraduate Certificate Programs in Medical Laboratory Science/Research and Allied Professions (CIP4 of 51.10)
For Other Fields of Study, Program Earnings Are More Consistent
For about 30 percent of the undergraduate certificate field-of-study groups defined by CIP4s (and which have at least two CIP6 programs in the group), the median earnings taken from across the earnings distributions of the underlying CIP6 programs are a better representation of the outcomes of students, with a spread of fewer than $10,000 between the lowest- and highest-earning programs.
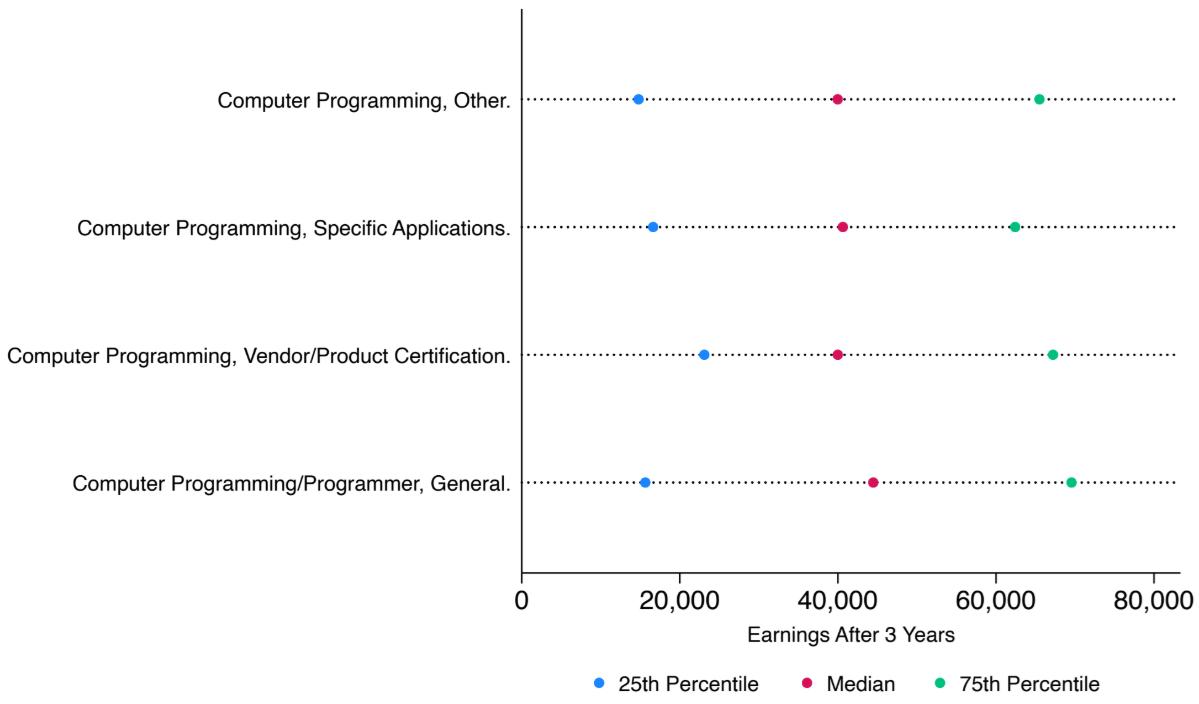
Consider, for example, undergraduate certificate programs in computer programming (CIP4 of 11.02). Outcomes of programs defined at the CIP6 level are all very similar, including for programmer certificates (CIP6 of 11.0201, with median earnings of $44,000) and vendor certificates (CIP6 of 11.0203, with median earnings of $40,000). In this case, the three-year median earnings of a program, even if defined at the four-digit CIP code level, will still provide an accurate representation of specific program outcomes at the six-digit CIP code level.
Fig 3. Undergraduate Certificate Programs in Computer Programming (CIP4 of 11.02)
Implications for Accountability
As the Department of Education works to implement the new OBBBA regulations on accountability, it needs to grapple with the complexity of this variation. Changing the level at which program earnings are measured is going to affect which programs pass and which fail accountability regulations. Programs of study that leave students with low earnings, perhaps hidden behind higher-earning programs within the same CIP4 in current College Scorecard data, may now be subject to sanction. On the other hand, programs that improve the median student’s labor market outcomes, but which were previously dragged down by an adjacent program that produce lower earnings in the same CIP4, may now be freed from close scrutiny.
This issue also has implications for how the Department reports earnings data for programs with few completers. As the Department has estimated, only about 9 percent of programs—albeit enrolling 56 percent of federally aided graduates—have at least 30 completers in a given year. The Department proposed to increase the number of programs where data can be reported by aggregating data in small programs with a complex, 15-step process that would first add up to five years of graduates to the cohort (one year at a time) within the same CIP6 and credential level combination; then combine between one and five years of graduates within the same CIP4 and credential level; then, finally, combine one to five years of graduates within the same CIP2, a much broader area of study.
The Department’s own estimates show the limited added value of this approach. By measuring earnings only within the same CIP6, for instance, the Department estimates it can already cover 82 percent of federally aided completers in undergraduate certificate programs by aggregating across years alone. Combining across CIP codes within the same CIP4 likely only marginally increases the coverage of the measures, up to an estimated 85 percent when totaled across five years of completers.
As our analysis shows, aggregating small programs to measure them at the field-of-study level, though, could have real downsides for the higher-earning programs within a field – and real upsides for the lower-earning ones. Some programs will be able to evade accountability by hiding their poor outcomes behind those of higher-earning programs. Other, well-paying programs could fail to pass the new accountability standards because they are combined with (and dragged down by) other, lower-earning programs in the same general field of study. In other words, the pass-or-fail status of some programs could be determined not only by their outcomes, but also by their program size. Aggregating small programs together to produce a single field-of-study number could also undermine students’ ability to make informed choices about which program will meet their career goals.


